
Introduction
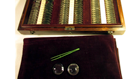
In Part One of this three-part series, I described the history and early use the American Optical (AO) “NBS Truepower lens set” developed in 1916, which was used to assess the calibration of the AO Lensometer when first introduced to the market. This set of glass lenses is what I treasure most in the Optical Heritage Museum collection. To my knowledge, there is no other set of lenses like it in the world.
What I did not state in Part One, is how I have used these lenses throughout much of my 40 year career with AO/Zeiss. In this second part of this series, I will examine how I utilized a working set of lenses calibrated to this NBS set in order to examine the accuracy of focimeters beyond the AO Lensometer. I have used this NBS traceable working set for most of my career. Most recently it was used in the Vision Council MLM Focimeter 2014 study on add power, where each focimeter was examined prior to the study to determine if the units were properly calibrated.
At the end of this article I suggest an inexpensive method on how to develop ones’ own set of reference lenses. These are useful to have to check consistency of readings from one device to another and also catch instrument drift over time.
Master NBS Lens Set
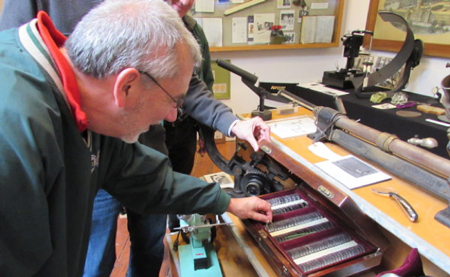
Early in my career at AO, I worked in the Quality department and I was assigned a very interesting and educational task. In our AOLITE plastic lens manufacturing site, the sorting of the lens powers prior to final packaging was done by measurement. When the lenses came down the conveyor belt there was no identification as to their actual lens power. To sort for packaging, three new AO built electronic Lensometers (nicknamed E01, EO2 and EO3) were designed and installed for factory use. At that time, we were also applying tolerances of 0.09 from nominal, rather than 0.12 used today. This meant some product would be rejected if the power was within that zone of non-acceptance from nominal power.
The problem I was faced with (which you might also be familiar with) is that one could take a lens found to be rejectable on one device, measure it on another device and find it acceptable or vice versa. I was assigned to make a set of glass standards that could be used in the factory. The lenses were meniscus in form to more closely match the geometry of the lenses being measured. The NBS set was actually designed with one of its surfaces being flat.
Developing the set of lenses for this purpose involved significant inspection and evaluation of glass Tillyer Masterpiece Single Vision lenses. I was looking to find lenses of low to zero measured astigmatism in order to have quality glass spheres. I selected over 100 lenses. I took lenses throughout the power range and also some spheres in the range of 6 to10 diopters made especially for this purpose. The convex and concave surfaces were examined via Zygo interferometry and our “reflection Lensometer” which measured surfaces in a 6mm aperture similar to AO’s Transmission Lensometer. Once assured the surfaces were good spheres, ten readings on the Transmission Lensometer were made, alternating between our NBS lens of similar calibrated power and then measuring the candidate Tillyer test lens. The scatter and differences were assessed and only lenses that showed good correlation were used.
Examining the focimeter “fingerprint” or calibration curves
Turning to their use, I have found this Master set to be great tool to compare focimeter calibration curves or “fingerprints”. Since there is a known calibration value for each lens in the set, if one takes multiple readings for each lens and records the average, the difference between measured and actual can be recorded. Doing this exercise over a large power range (+/- 8 D) can be very instructive. Lets look at how they have been used.
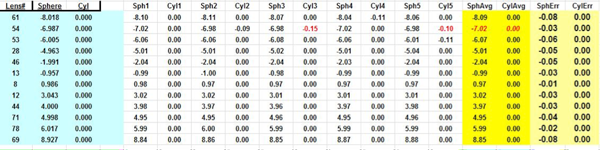
Shown below is an example of measurements of the calibration lenses on a specific device. The known calibration values for each lens are shown under the “sphere” and “cyl” columns in blue. The sph1, sph2 and sph3 values are the actual measured values on that unit measured 3 times. Likewise, the cyl values (shown as all zeroes here) are also averaged. Some units display non zero values even for perfect spheres which is why this is captured. Shown in yellow are the averages of the three readings, while the final columns show the errors from the certified values. It is this error value that proves useful and will be plotted in subsequent graphs.
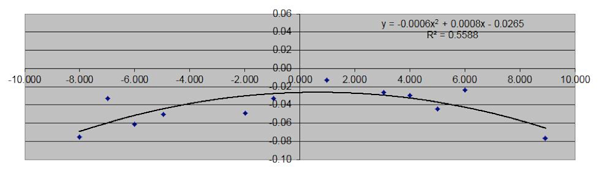
Looking at the plot below, the blue dots represent the SphErr averages for each lens. The line drawn is a best fit polynomial (easily done in Excel), and the equation shown in the upper right describes this error curve.
The next plot shows the shape of error curves on a variety of devices. Each curve was generated in the same way as described above. You will note that some have a significant difference in their curves, especially for extreme powers.
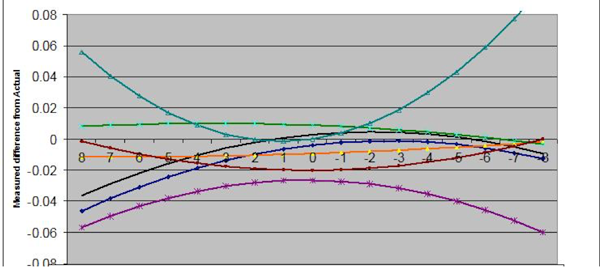
While each unit can be considered ‘in calibration’, two commonly used focimeters show significant “signature” differences from one another. I have broken two examples out from the above plot and show them below.
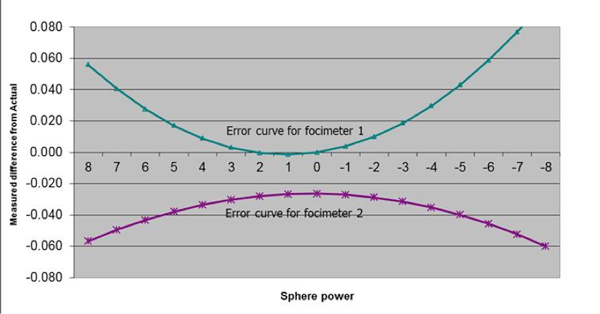
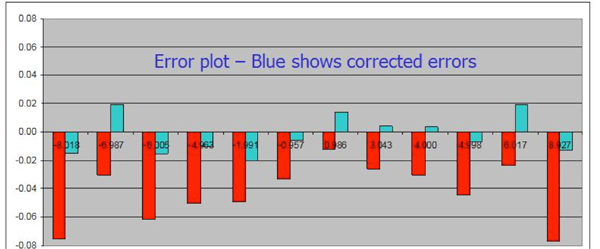
One can see they have noticeably different error curves, especially for higher powers. Experience has taught me that such signature curves are generally of similar shape for a given device manufacturer / model when first purchased and the device is new. I have discovered that for some electronic devices, this calibration curve may shift over time as age and dirt influence the calibration. For this reason, I suggest periodic testing of a device with a known set of lenses as I will discuss at the end of this article. To see how generating our error curves might be applied to improve our device output, lets examine the next bar plot and its meaning. The red error bars indicate the difference from measured value of our calibration lenses on a given device. When the polynomial best fit correction is applied to the readings, the blue errors are the end result. In theory, this is one way to reduce measurement differences when using multiple instruments.
In part three of this series I will share ideas and methods for creating your own calibration set of lenses. Should you wish to learn more about this topic, feel free to contact me at [email protected]